Corporate Valuation Basics — P/E Ratio, EPS, Book Value & More
Learn how to analyze companies using key valuation metrics like P/E ratio, EPS, and book value. Understand what these numbers reveal about a stock’s true worth before investing.
RAVINDRA PRAJAPATI (EDUCATIONAL BLOG)
10/7/20253 min read
Introduction: Why Company Valuation Matters
Before you invest in a stock, you’re essentially buying a piece of a business.
But how do you know if that piece is fairly priced, overvalued, or undervalued?
That’s where corporate valuation metrics come in — numbers that reveal how the market views a company’s performance, profit potential, and financial health.
Let’s decode the most important ones ..
1. P/E Ratio (Price-to-Earnings Ratio) — The Popular Yardstick
Formula:
P/E Ratio = Market Price per Share ÷ Earnings per Share (EPS)
What it means:
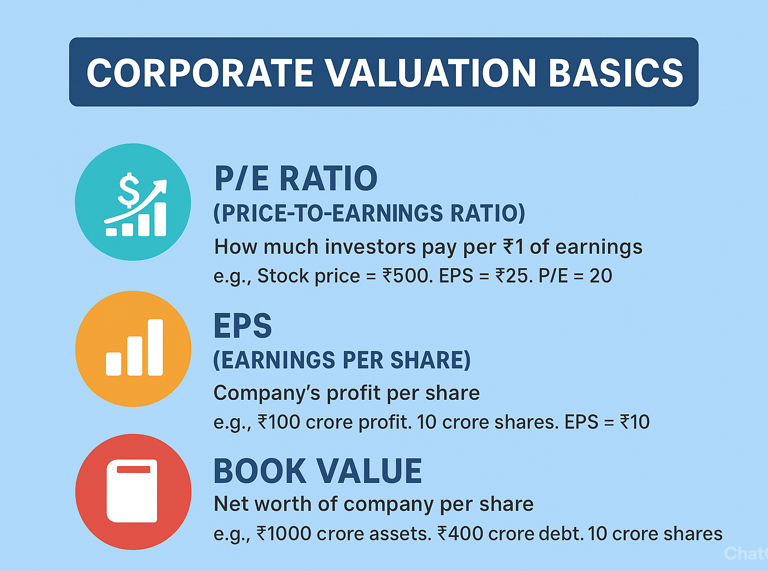
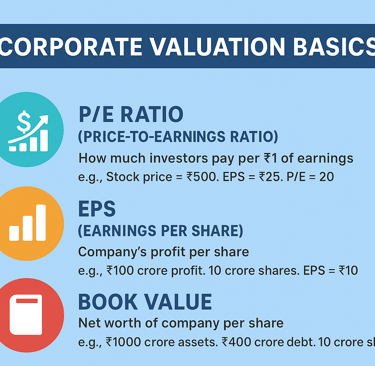
It shows how much investors are willing to pay for ₹1 of a company’s earnings.
High P/E = investors expect strong future growth.
Low P/E = the stock may be undervalued or facing weak growth.
Example:
If a company’s stock trades at ₹500 and its EPS is ₹25,
P/E = 20.
That means investors are paying ₹20 for every ₹1 of earnings.
Pro Tip:
Compare P/E with peers in the same sector. A high P/E in IT may be normal, but alarming in manufacturing.
2. EPS (Earnings Per Share) — The Profit Indicator
Formula:
EPS = Net Profit ÷ Total Number of Shares Outstanding
What it means:
EPS shows how much profit a company makes for each share.
Higher EPS = better profitability.
Falling EPS = weak growth or rising costs.
Example:
If a company earns ₹100 crore and has 10 crore shares,
EPS = ₹10.
Watch out:
One-time gains can inflate EPS — always check consistent earnings across years.
3. Book Value — The Asset Reality Check
Formula:
Book Value per Share = (Total Assets – Total Liabilities) ÷ Total Shares
What it means:
It represents the net worth of the company per share based on accounting records.
If the market price is much higher than book value → investors expect high future growth.
If it’s close to or below book value → the stock may be undervalued.
Example:
If a company has ₹1000 crore in assets and ₹400 crore in liabilities, with 10 crore shares:
Book Value = ₹60/share.
Pro Tip:
For financial or manufacturing companies, book value is a strong indicator. For tech companies, less so.
4. P/B Ratio (Price-to-Book Ratio) — Market’s Trust in Assets
Formula:
P/B Ratio = Market Price per Share ÷ Book Value per Share
What it means:
Tells you whether investors believe the company’s assets are worth more (or less) than the books show.
P/B < 1 → undervalued or asset-heavy business.
P/B > 3 → high market confidence or overvaluation.
Example:
Stock price ₹120, book value ₹60 → P/B = 2.
The market values the company at 2× its book value.
5. Dividend Yield — Reward for Shareholders
Formula:
Dividend Yield = (Dividend per Share ÷ Market Price per Share) × 100
What it means:
Measures cash return investors get from owning the stock.
High yield = stable, mature company.
Low yield = company reinvesting profits for growth.
Example:
If a company pays ₹5 dividend on a ₹100 stock, yield = 5%.
6. Debt-to-Equity Ratio — The Financial Stability Test
Formula:
Debt-to-Equity = Total Debt ÷ Shareholder’s Equity
What it means:
Measures how much of the company’s operations are financed by borrowed money.
D/E < 1 → financially healthy.
D/E > 2 → risky and leveraged business.
Tip:
Compare across similar industries — capital-heavy sectors like infrastructure often have higher ratios.
7. ROE (Return on Equity) — Efficiency in Earning Profits
Formula:
ROE = (Net Income ÷ Shareholder’s Equity) × 100
What it means:
Shows how efficiently the company uses shareholder money to generate profits.
ROE between 15–20% is usually considered strong.
Example:
If a company earns ₹30 crore profit with ₹150 crore equity,
ROE = 20%.
8. EV/EBITDA — The Real Value Ratio
Formula:
EV/EBITDA = Enterprise Value ÷ Earnings Before Interest, Taxes, Depreciation & Amortization
Why it matters:
EV/EBITDA is a debt-adjusted P/E ratio — helps compare companies with different debt levels.
Lower EV/EBITDA = potentially undervalued.
Higher = growth expectations priced in.
Conclusion: Numbers Tell a Story — If You Know How to Read Them
Valuation is not just about numbers — it’s about understanding the story behind those numbers.
Combine multiple ratios, compare with peers, and always analyze industry trends, management quality, and financial consistency.
That’s how you identify not just a stock — but a valuable business.
RAVINDRA PRAJAPATI, Not a sebi registered
FOLLOW Us
ravindra.prajapati1122@gmail.com
+91 9795187745
© 2025. PiPiFinTech All rights reserved.
Contact Us
ABOUT Us
Our mission is to empower you to maximize every single penny and best solution for wealth generation and management for every mature age group.
Product TOPICS
Digital E-Wealth Platform
Mutual Funds
Education Planning
Insurance
FD and Bonds
Retirement Planning
Wealth Creation
(Disclaimers : Mutual Fund investments are subject to market risks, please read scheme related documents carefully.)